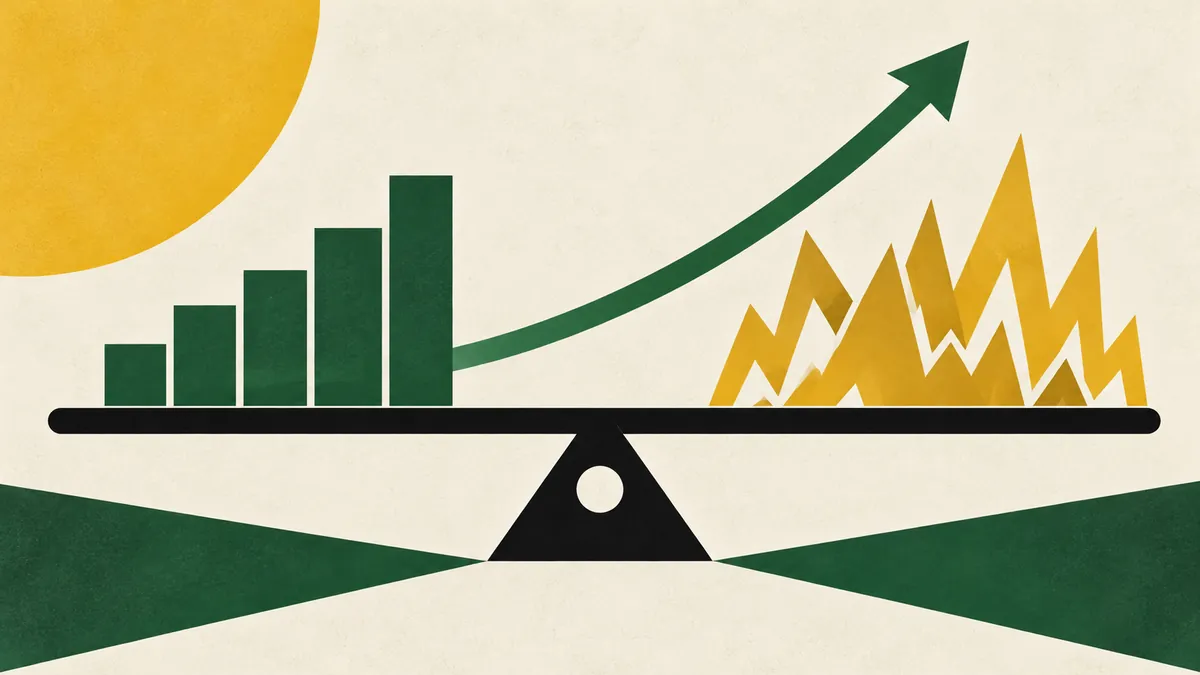
Two investments deliver 10% per year over a decade. One barely budged along the way; the other had a 50% drawdown midway. Should you treat them as equal? The Sharpe ratio says no.
The Formula
Sharpe ratio = (Portfolio return − Risk-free rate) / Standard deviation of returns
In plain English: how much extra return did you get for each unit of volatility you absorbed? Higher is better.
A Real Example
- Fund A: 10% return, 6% volatility, 4% risk-free → Sharpe ≈ 1.00
- Fund B: 10% return, 18% volatility, 4% risk-free → Sharpe ≈ 0.33
Both delivered 10%, but Fund A did it three times more efficiently. Over decades, the smoother fund is also less likely to push you into selling at the bottom.
Why It Matters in Practice
The Sharpe ratio gives a number to a feeling. The wild-ride fund might look exciting on its best year, but a low Sharpe ratio means most of the return came from luck of timing — not durable skill.
Limits of Sharpe
- Treats upside and downside volatility identically (the Sortino ratio fixes this).
- Assumes returns are roughly normally distributed (they aren't, especially in crises).
- Past Sharpe doesn't always predict future Sharpe.
How to Use It
When choosing between funds in the same category, prefer the higher Sharpe ratio. Most fund websites and Morningstar pages publish it. Our ROI Calculator and CAGR Calculator give you the return inputs; subtract a 4% risk-free rate and divide by the fund's standard deviation to compute your own.
Bottom Line
Total return tells you what an investment earned. Risk-adjusted return tells you whether it was worth it. Both matter.
Frequently Asked Questions
What does the Sharpe ratio actually measure?
The Sharpe ratio measures how much extra return an investment produced above a risk-free rate for each unit of volatility (risk) it took on, calculated as excess return divided by standard deviation of returns. A higher Sharpe ratio means an investment generated its returns more efficiently, or more smoothly, relative to the risk taken. Two investments with an identical 10% return can have very different Sharpe ratios if one is far more volatile than the other.
Why might two funds with the same return not be equally good investments?
Because total return alone doesn't capture how bumpy the ride was to get there — a fund that returned 10% with a large mid-period drawdown carries more risk, and more temptation to sell at the wrong time, than a fund that returned 10% smoothly. The Sharpe ratio is one common way to adjust for this by dividing excess return by volatility. This is why risk-adjusted metrics, not raw returns alone, are generally considered a more complete way to compare investments.
What are the limitations of the Sharpe ratio?
The Sharpe ratio treats upside and downside volatility identically, even though most investors only really mind the downside, and it assumes returns follow a roughly normal statistical distribution, which often breaks down during market crises. It's also backward-looking, so a fund's historical Sharpe ratio doesn't guarantee its future risk-adjusted performance. The Sortino ratio is a related metric that addresses the upside/downside asymmetry issue.
Run the numbers yourself
Plug your own inputs into our free calculators — no signup.